![[Deprecated]](figures/lifecycle-deprecated.svg)
Arguments
- data
A tidy time series object (tsibble)
- y
The variable to plot (a bare expression). If NULL, it will automatically selected from the data.
- period
The seasonal period to display. If NULL (default), the largest frequency in the data is used. If numeric, it represents the frequency times the interval between observations. If a string (e.g., "1y" for 1 year, "3m" for 3 months, "1d" for 1 day, "1h" for 1 hour, "1min" for 1 minute, "1s" for 1 second), it's converted to a Period class object from the lubridate package. Note that the data must have at least one observation per seasonal period, and the period cannot be smaller than the observation interval.
- facet_period
A secondary seasonal period to facet by (typically smaller than period).
- max_col
The maximum number of colours to display on the plot. If the number of seasonal periods in the data is larger than
max_col, the plot will not include a colour. Usemax_col = 0to never colour the lines, or Inf to always colour the lines. If labels are used, then max_col will be ignored.- max_col_discrete
The maximum number of colours to show using a discrete colour scale.
- pal
A colour palette to be used.
- polar
If TRUE, the season plot will be shown on polar coordinates.
- labels
Position of the labels for seasonal period identifier.
- labels_repel
If TRUE, the seasonal period identifying labels will be repelled with the ggrepel package.
- labels_left_nudge, labels_right_nudge
Allows seasonal period identifying labels to be nudged to the left or right from their default position.
- ...
Additional arguments passed to geom_line()
Value
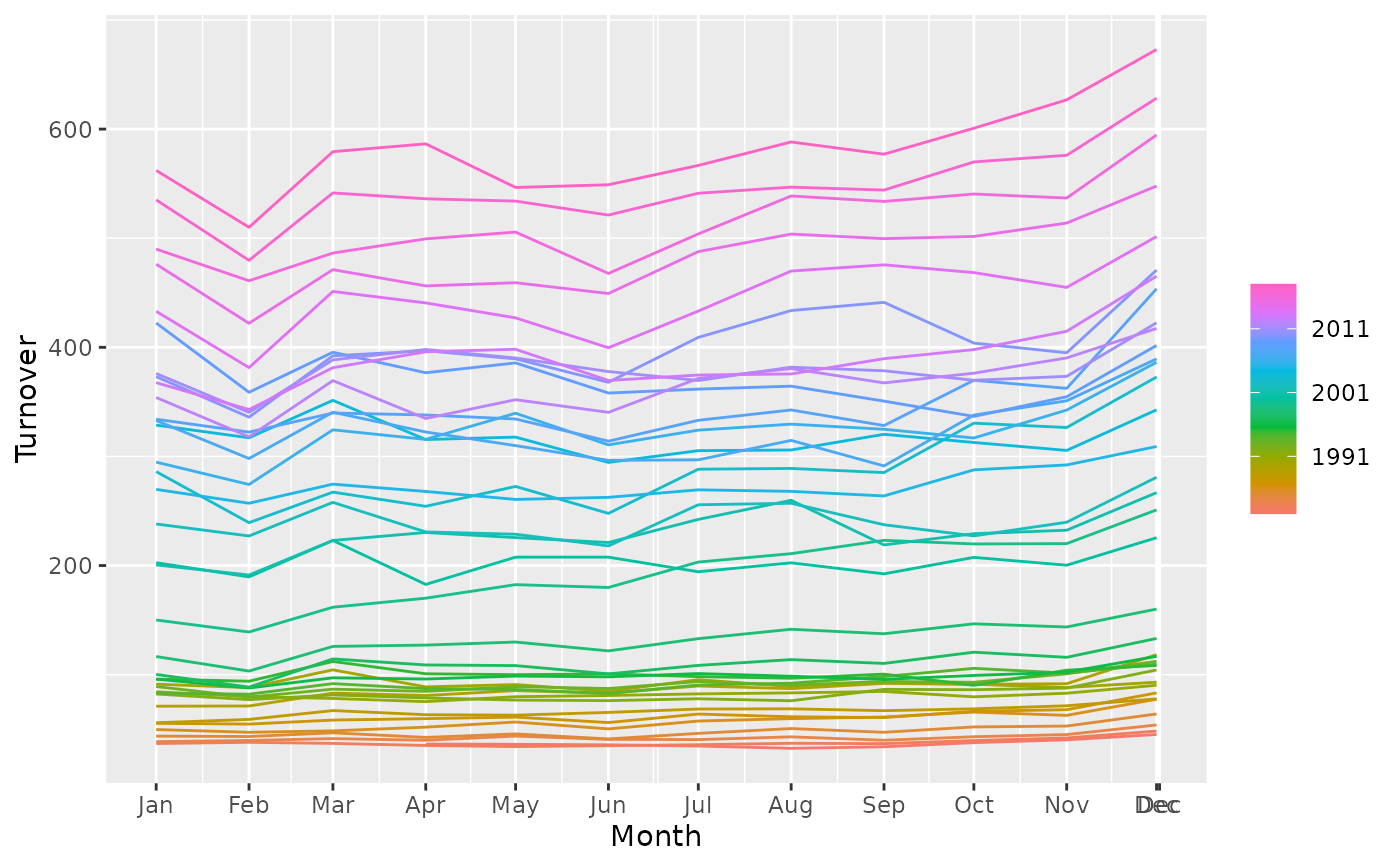
A ggplot object showing a seasonal plot of a time series.
Details
gg_season() was soft deprecated in feasts 0.4.2. Please use ggtime::gg_season() instead.
Produces a time series seasonal plot. A seasonal plot is similar to a regular time series plot, except the x-axis shows data from within each season. This plot type allows the underlying seasonal pattern to be seen more clearly, and is especially useful in identifying years in which the pattern changes.
References
Hyndman and Athanasopoulos (2019) Forecasting: principles and practice, 3rd edition, OTexts: Melbourne, Australia. https://OTexts.com/fpp3/