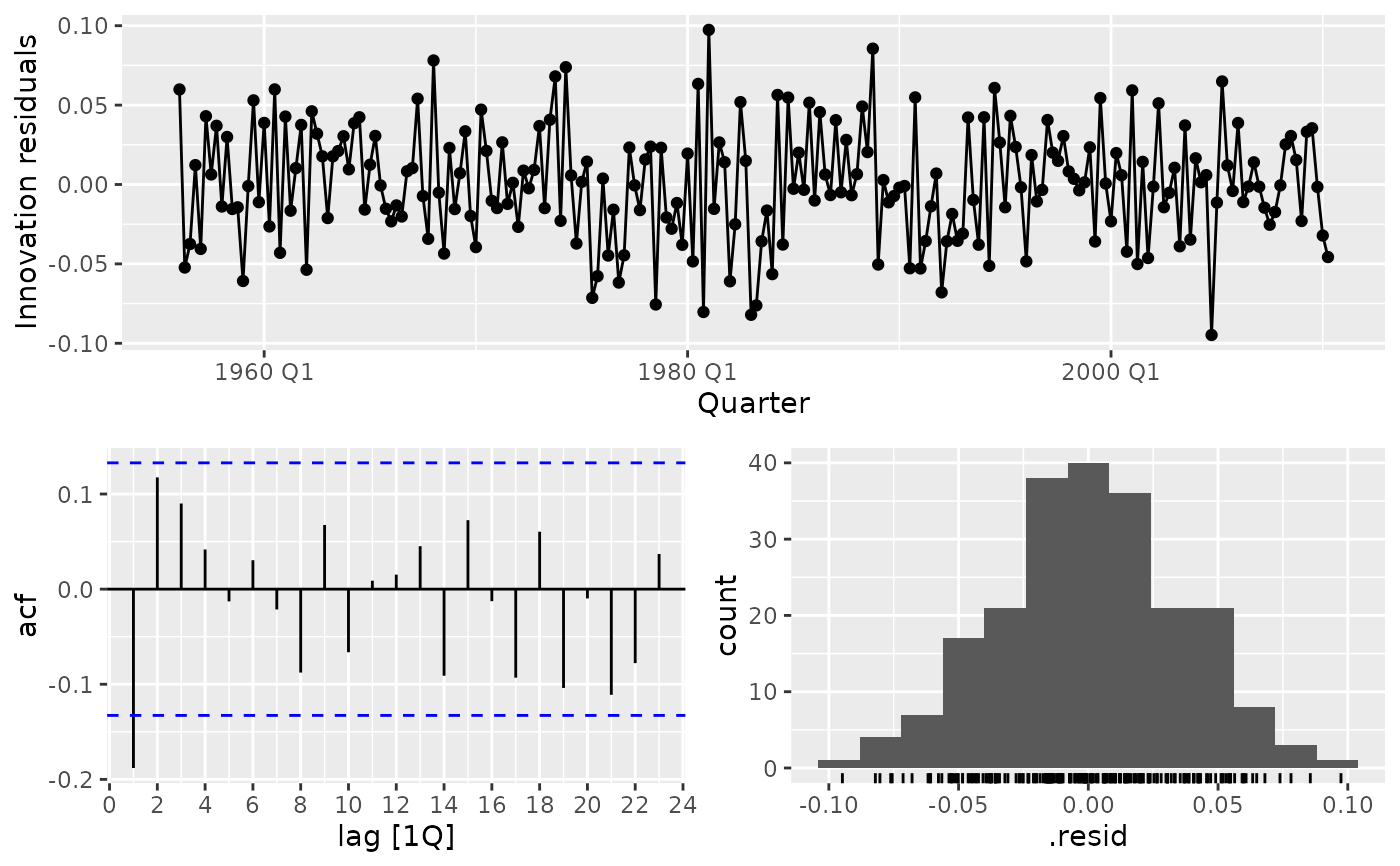
Plots the residuals using a time series plot, ACF and histogram.
gg_tsresiduals(data, type = "innovation", ...)Arguments
- data
A mable containing one model with residuals.
- type
The type of residuals to compute. If
type="response", residuals on the back-transformed data will be computed.- ...
Additional arguments passed to
gg_tsdisplay().
Value
A list of ggplot objects showing a useful plots of a time series model's residuals.
References
Hyndman and Athanasopoulos (2019) Forecasting: principles and practice, 3rd edition, OTexts: Melbourne, Australia. https://OTexts.com/fpp3/
See also
Examples
if (requireNamespace("fable", quietly = TRUE)) {
library(fable)

tsibbledata::aus_production %>%
  model(ETS(Beer)) %>%
  gg_tsresiduals()
}